Introduction
Biochemical analysis of protein function and performance is one of the most fundamental research steps on the way the industrial usage of e.g. enzymes that are used to lower the energy consumption of industrial processes or to facilitate extremely complicated chemical modifications.
For that, recombinant expression of proteins in bacterial cell culture is an important laboratory task, that enables the user to produce engineered enzymes in large quantities. Here, we show that the usage of the fluidlab R-300 enables the user to perform the full quality control of expression systems by using one handheld device. Those include precise assessment of the bacterial growth curve via OD600 stray light measurements as well as the colorimetric determination of the protein yield by Bradford’s reagent. The fluidlab R-300 can easily be used to, on the one hand set up standard parameters in screening experiments, and on the other hand directly use the determined parameters on the production floor without the need of another method transfer step.
Material and Methods
Lemo21 E. coli cells were transformed with a pLEMO plasmid containing a Chloramphenicol
resistance cassette for negative selection as well as the gene for the protein of interest controlled by an upstream Lac-Operon. We chose a Cytochrome P450 enzyme as a model enzyme, as those bear interesting catalytic opportunities for the hydroxylation of aromatic compounds. To yield sufficient expression FeCl3 and δ-aminolevulinic acid were added to the LB growth medium to ensure correct incorporation of heme groups to form the holo-complex.
Growth Curve
The E.coli growth curve was monitored at 37°C under constant shaking for 90 hours after inoculation of an overnight pre-culture, using the fluidlab’s adapter 3 and a fixed wavelength of 600 nm. From pre-experiments it was shown that the linear phase starts at 0.3 such that at this pointthe induction with IPTG could be performed.
Calibration Curve, cell lysis and protein amount determination
A calibration curve for the determination of overall protein expression was prepared using Bovine Serum Albumin (Sigma Merck, Germany) in a ready-to-use Bradford solution purchased as well from Sigma (Germany). Cell lysis was performed in Triton-X buffer to yield soluble membrane fractions and subsequent sonification. The supernatant was then consequently measured for protein yield and correct heme-incorporation by spectrophotometry.
Results
Growth Curve
The growth curve is shown in figure 1 and displays a solid linear growth behavior until an OD
of approximately 0.8 at which the system converges into saturation.

Figure 1: E. Coli growth curve (innoculation of IPTG at an extinction of 0.3)
Calibration curve
A standard curve was calculated with the on-device application “Calibration Curve” using BSA and the manufacturers instructions for curve preparation. Yielding a R2 of 0.98 (Figure 2).
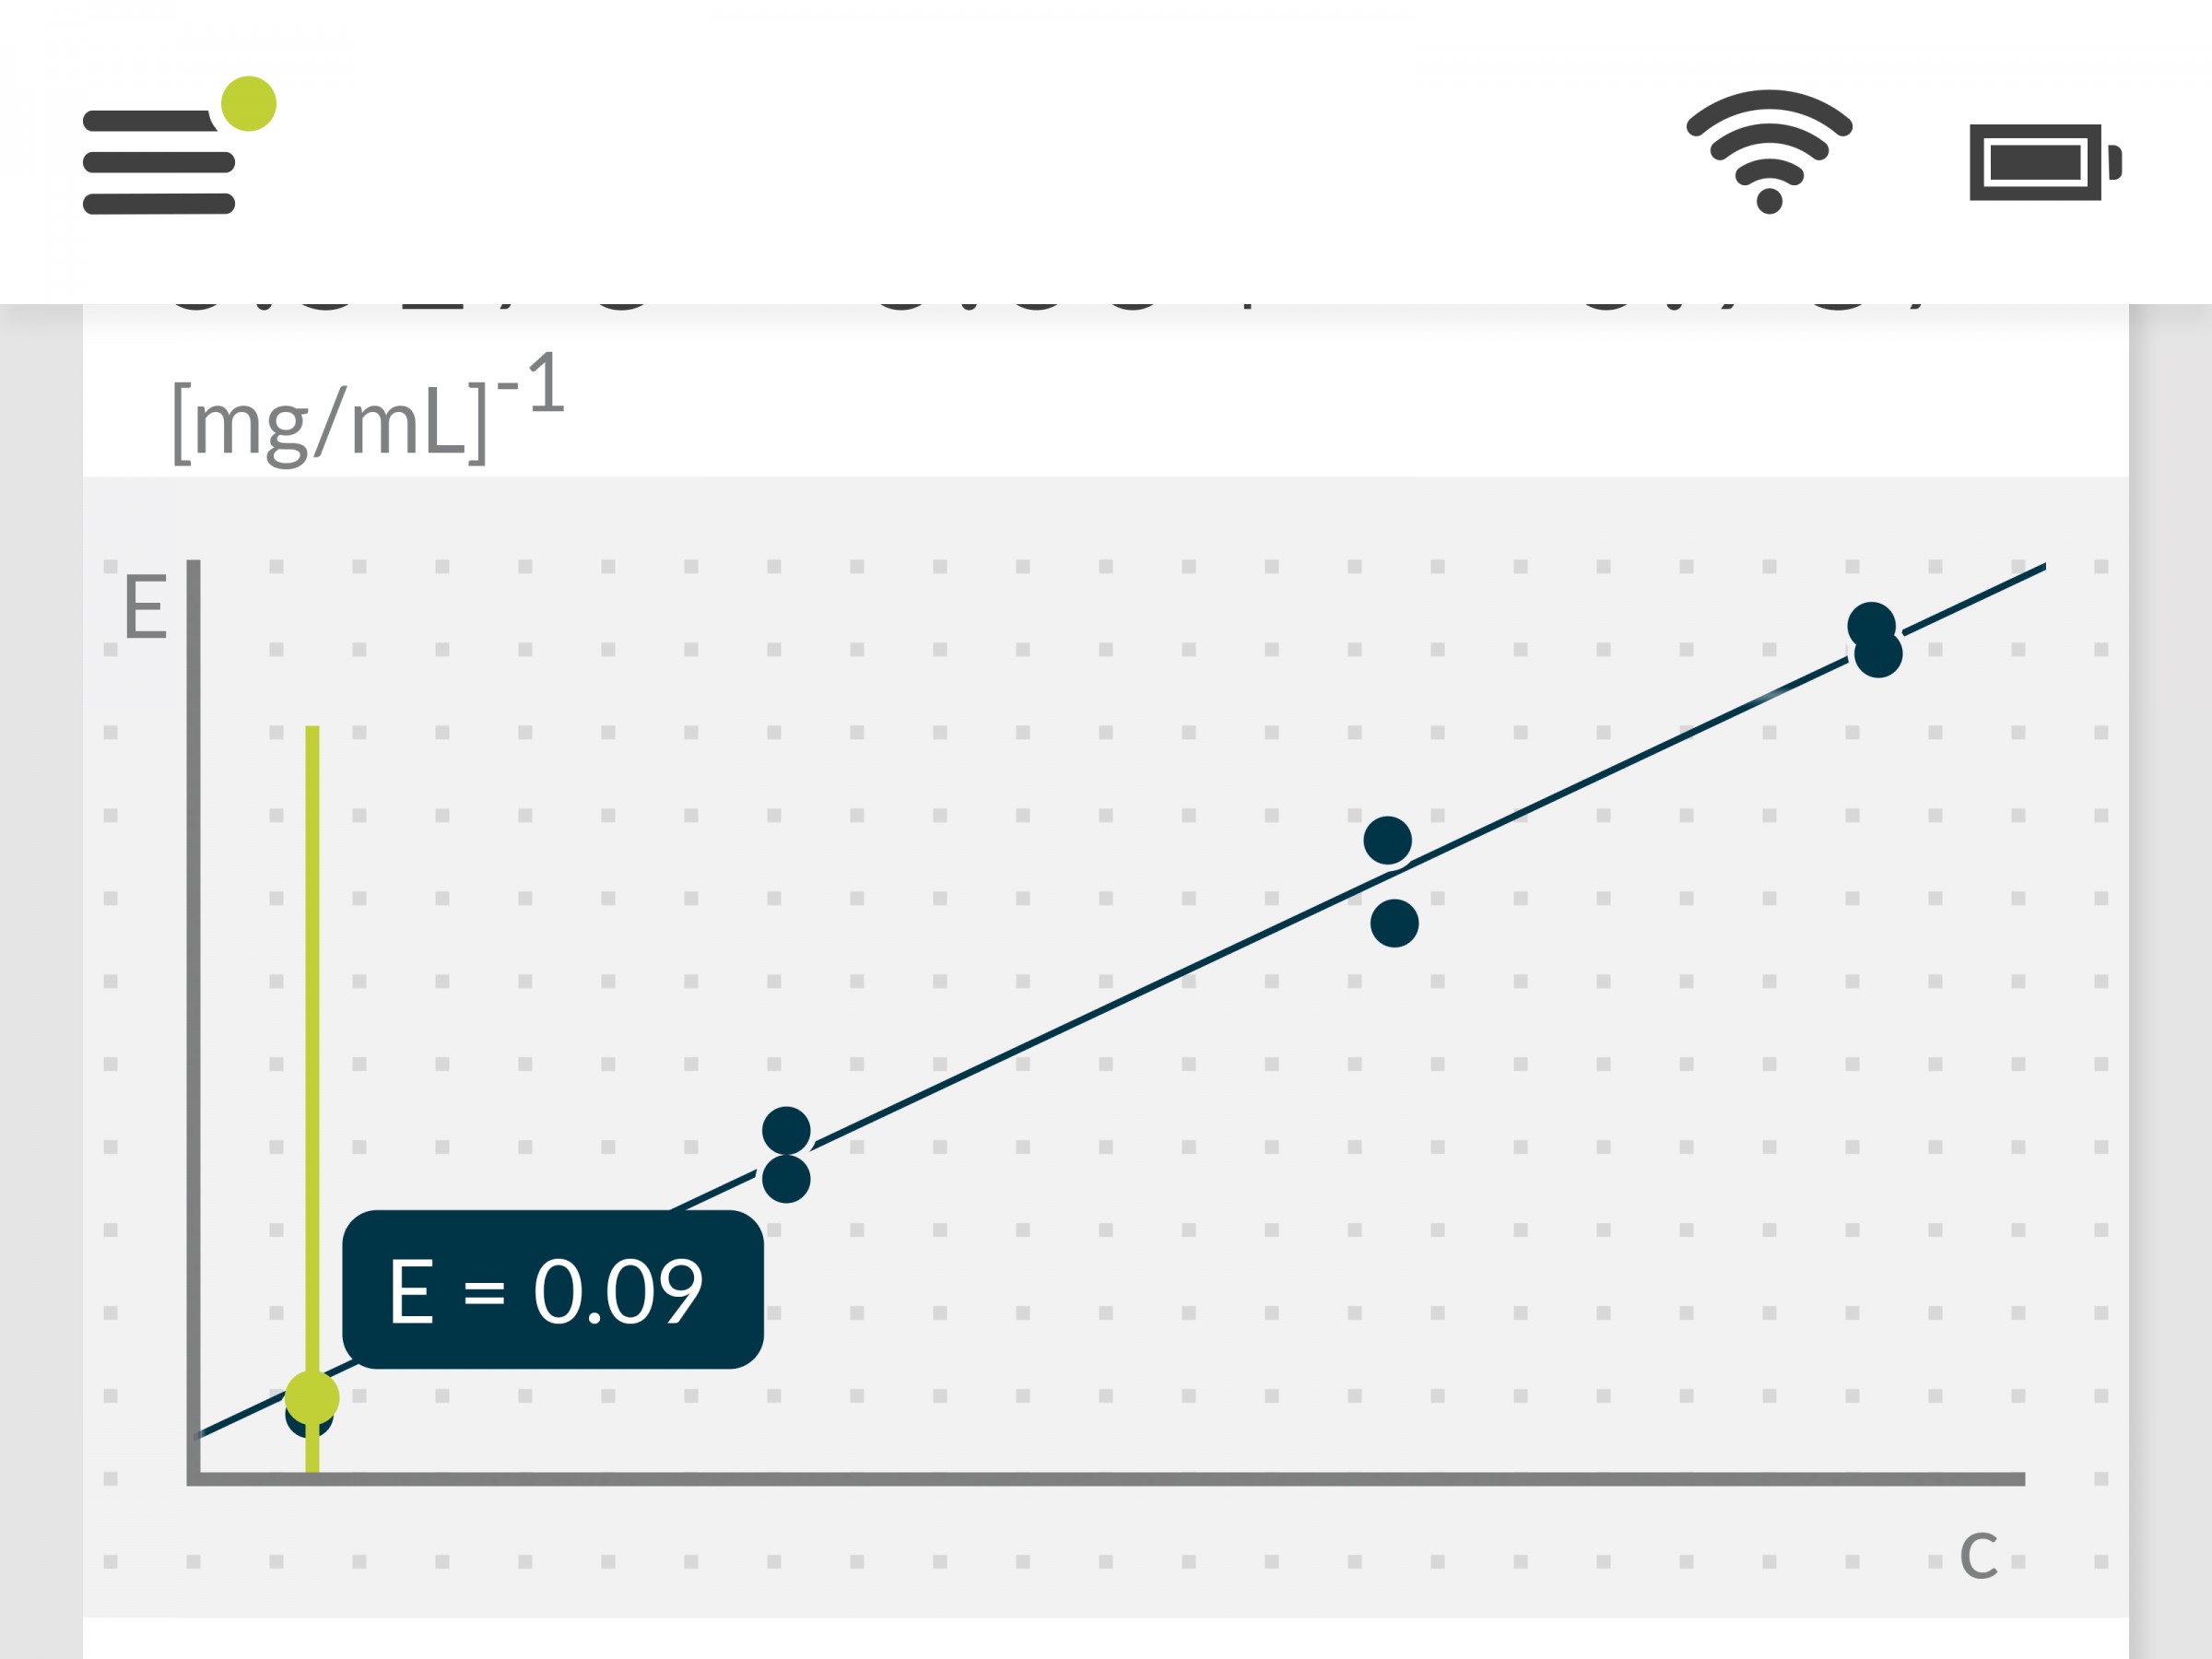
Figure 2: Display of the fluidlab R-300 for the calibration curve (in doubles)
Protein concentration determination
Via the built-in concentration curve app, the cell lysate’s protein concentration in triplicates and the results are shown in Table 1, resulting in a %CV of 1% for the extinction and 2% for the concentration, respectively.

Figure 3: Protein determination of cell lysate
Spectrophotometric observation of heme-incorporation
The supernatant showed the typical maximum at 421nm together with two minor peaks at 575nm and 600nm belonging potentially to either debris, mis-incorporation of the heme function or other incorporated metal ions (Figure 4).

Figure 4: Observation of heme absorption via spectrometry
Estimation of heme occupancy
From earlier experiments, the molar extinction coefficients of the heme moieties were known
and hence, the molar ratio
𝜒 =𝑐(ℎ𝑒𝑚𝑒)/𝑐(𝑝𝑟𝑜𝑡𝑒𝑖𝑛)= 23%
could be determined.
Discussion
Protein expression from heterologous systems such as E. coli is an important tool for many
research fields. Here, we showed that the full quality assessment of a P450 enzyme expression was done using the fluidlab R-300. We have shown that using this tool and with standard chemicals we could assess the purity and heme incorporation degree of the produced enzyme to be just 23%. We can conclude that three actions should be done to have a closer look on this number. Firstly, the P450 oxidoreductase expressed was by means just a fraction of a total pool of peptides determined by the Bradford assays and this fraction should be determined using either SDS-PAGE or even mass spectrometric analysis. Secondly, the cell lysate was not centrifuged yielding to high impurities, which are visible in the spectrum as a near-UV peak next to the actual heme-containing fractions. Lastly, the uptake of FeCl3 and δ-aminolevulinic acid by bacterial cells should potentially be either monitored or at least varied to improve the hemeincorporation by shifting the enzyme towards the wanted fractions. Monitoring could again be done by photospectrometry using e.g. ferrozine as a chelating agent for colorimetric determination. Overall, all steps in this quality assessment were done via a handheld spectrophotometer, which makes the quality control e.g. in the production environment directly feasible without any method transfer towards another analytic system.